Pt 3 - Predicting total NHL Team Wins with Machine Learning - 2022/23 Season
Advanced Stats Primer
Advanced stats, also known as analytics or sabermetrics, are statistical measures that aim to better understand and evaluate the performance of hockey players and teams. These stats go beyond traditional box score statistics, such as goals, assists, and plus/minus, to provide a more comprehensive view of a player's contribution to their team's success.
One common advanced stat used in the NHL is Corsi, which measures shot attempts (shots on goal, missed shots, and blocked shots) for and against while a player is on the ice. This stat is used to evaluate a player's possession and territorial control, as well as their ability to generate and suppress shot attempts. Another advanced stat is Fenwick, which is similar to Corsi but excludes blocked shots.
Expected goals (xG) is another advanced stat that uses data on shot location, type, and situation to estimate the likelihood of a shot becoming a goal. This stat can be used to evaluate a player's offensive and defensive abilities, as well as the effectiveness of their team's shooting and goaltending.
Advanced stats are also used to evaluate a player's overall performance beyond just their offensive or defensive contributions. For example, a player's individual expected goals against (ixGA) can be used to assess their defensive play, while their individual expected primary assists (ixA) can be used to evaluate their playmaking ability.
Advanced stats are not without their limitations, as they are based on limited sample size and do not account for factors such as team strategy, special teams play, and injuries. However, when used in conjunction with traditional stats and subjective analysis, advanced stats can provide valuable insights into the performance of hockey players and teams.
Corsi Score:
The NHL has been using a statistical measure known as Corsi to evaluate the performance of its players and teams. It is a widely-used advanced statistic that aims to evaluate a player or team's performance by measuring the number of shot attempts they generate and allow.
Originally developed to better measure the workload of a goaltender during a game, Corsi has evolved to approximate shot attempt differential for teams and players. It is used to approximate puck possession (length of time a player's team controls the puck) and is typically measured as either a ratio (like plus-minus) of shot attempts for less shot attempts against, or as a percentage (CF*100/(CF+CA)).
The concept of Corsi was first introduced by sports analyst and blogger Tim Barnes in 2007. Barnes developed the statistic in order to better evaluate the performance of hockey players and teams, inspired by the work of other sports analysts who had developed advanced statistics in other sports, such as basketball and baseball. It is calculated by taking the sum of all shot attempts for and against while a player is on the ice, and then subtracting the number of shot attempts against from the number of shot attempts for to determine the net shot attempts.
Corsi has become increasingly common in the NHL, as it provides a more comprehensive measure of a player or team's performance than traditional statistics such as goals, assists, and plus/minus. Traditional statistics only take into account the end result of a play, while Corsi takes into account all of the events leading up to the end result, allowing analysts and coaches to better understand the underlying dynamics of a game and make more informed decisions.
What about “Fenwick”?

Fenwick is a statistic that measures shot attempts (shots on goal and missed shots) for and against a player or team while they are on the ice. It is similar to Corsi, which also measures shot attempts but excludes blocked shots.
To calculate Fenwick, you must gather data on all shot attempts (both on goal and missed) for and against a player or team while they are on the ice. Subtract the number of shot attempts against from the number of shot attempts for to get the Fenwick score. A positive Fenwick score indicates the player or team had more shot attempts than their opponents, while a negative score means the opposite.
For example, if a player was on the ice for 10 shot attempts for and 8 shot attempts against, their Fenwick score would be +2. If they were on the ice for 8 shot attempts for and 10 shot attempts against, their Fenwick score would be -2.
Fenwick is often used as a proxy for possession and territorial control, as it measures the number of shot attempts a player or team is able to generate and suppress. It is also used to evaluate a player's offensive and defensive abilities, as well as the overall performance of a team. However, Fenwick, like all advanced stats, has its limitations and should be used in conjunction with traditional stats and subjective analysis.
The rise of Expected Goals
The expected goals (xG) statistic is a popular tool used by hockey analysts and fans to evaluate a team's performance on the ice. It is a measure of the quality of chances a team creates and concedes during a game, providing a more nuanced view than traditional statistics like goals scored or shots on goal.
In a nutshell, expected goals measures the likelihood that a given shot will result in a goal, based on factors such as the location of the shot, the type of shot (e.g. wrist shot, slap shot, etc.), and the situation (e.g. power play, even strength, etc.). The resulting number, expressed as a decimal, represents the average number of goals a team would be expected to score based on the quality of chances they create.
For example, if a team has an xG of 1.5 in a game, it means that they created chances that, on average, would result in 1.5 goals. If they actually scored two goals, they outperformed their xG and were likely the better team on the ice. Conversely, if they scored only one goal, they underperformed their xG and may have been somewhat lucky to come away with a win.
Expected goals is a result of a model output, not a calculated statistic. As such, expected goals can differ depending on the feature selection and significance of the individual metrics used in the specific model. There can be any number of expected goals calculations available at any one time using NHL play-by-play data. Therefore, it is important to use the same source when using the expected goals statistic to ensure consistent results.
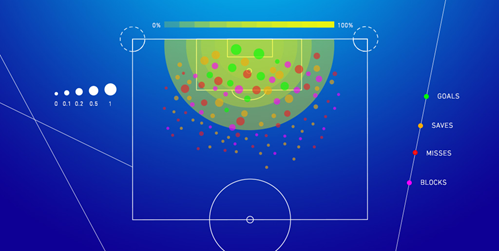
Low, medium, and high danger chances are scoring chances and the likelihood of them resulting in a goal. Many factors are taken into account to determine if a danger chance is low, medium, or high. The most dangerous area on the ice with regards to a goal is a “home plate” shaped space that begins in front of the net and widens out to the faceoff dots in the offensive zone. Typically, more than 75% of goals are scored from within this high danger location, sometimes referred to as the “slot” or “house” area.
To classify a danger chance, we start with where the shot was taken from. Shots from the defensive or neutral zones are discarded. The offensive zone is divided into three areas: high danger (red), danger (yellow), and outside these areas but still inside the offensive zone (1). A value of 1 is added if the shot attempt occurs on a rush or is a rebound. The value is decreased by 1 if the shot attempt was blocked. A total value of 3 or higher is considered a “high danger chance”, a value of 2 is a “medium danger chance”, and a value of 1 or less is a “low danger chance”.
One of the main advantages of expected goals is that it takes into account the quality of chances, rather than just the quantity. For instance, a team that fires a lot of low-percentage shots from the perimeter is not likely to score many goals, even if they register a high number of shots on goal. By contrast, a team that generates high-quality chances from in close is more likely to score, even if they don't register as many shots on goal. Expected goals accounts for this difference and provides a more accurate picture of a team's performance.
In addition, expected goals can be used to evaluate individual players. For example, a player who consistently generates high-quality scoring chances is likely to have a high xG, while a player who primarily takes low-percentage shots is likely to have a lower xG. This can provide valuable insight into a player's offensive abilities and help coaches and managers make personnel decisions.
Overall, the expected goals statistic is a valuable tool for analyzing a team's performance and identifying areas for improvement. It provides a more nuanced view of a team's performance on the ice and can help coaches, players, and fans better understand the game. Additionally, it is used to predict the outcome of individual games and whole seasons, and to measure how a team performed against what was expected of them.