Pt 2 - Predicting total NHL Team Wins with Machine Learning - 2022/23 Season
Scoring Model
After identifying our hypothesis and associated historical data set, we further explored which data points our model could forecast. Initially we thought that wins and losses for all teams, then calculate the team rankings from those wins and losses as it appeared easier to see tangible results from game scores as the season progresses.
In this model we’ll look at previous data from previous season to predict win totals for the next season. We will then use the total predicted wins, losses and overtime losses to calculate point totals for overall team standings (rankings).
By composing a list of all statistics that may affect a if a team wins or loses a game. We will then review all the statistic categories that we listed and then determine which can be excluded from the model and which one warrant further review. Scoring will be based on the following:
| Outcome | Points |
| Win (Regulation) | 2 |
| Win (Overtime) | 2 |
| Loss (Overtime) | 1 |
| Loss (Regulation) | 0 |
Note: this model will also be predicting overtime losses since teams will receive 1 point for an OT loss.
Data Selection
Once we have decided on our hypothesis and scoring model, the next step is data collection to prove or disprove our hypothesis. When collecting data there are a few variables to keep in mind:
- How accurate is the data?
- How reliable is the source/sources?
- Does this data have all the stats (features) that I’m looking for?
- Less commonly used stats may be hard to find.
- What format is data provided?
- Is the data free or is there a cost
- How much data cleansing will be required?
In some scenarios, using data from multiple sources may be needed. For speed to value in this initial model we are sourcing data from SportWise by Rolling Insights, which provides historical NHL data as well as other major sports that can be downloaded in .csv format.
Combining disparate data sources in Microsoft Azure Machine Learning Studio is possible but it was a complex and involved process. For the size of this data set, it was easier to clean the data manually; with find and replace in excel. Joining data sets beforehand is recommended.
This experiment used 2020 and 2021 NHL data to predict 2022 outcomes.
Initial Exploitation for NHL Win Prediction using Time Series Forecast
Step to creating Time Series Forecast:
- Collected/formatted NHL team data and uploaded to Azure ML
- Built model with all features (columns) and target set to Wins
- Ran model (train) to determine feature significance regards to team wins & best (most efficient) ML Algorithm for dataset
- Features can be ranked by significance to target (wins)
- Various metrics can be used to determine efficiency of model
- Normalized Root Mean Square Error & R Squared Score used to determine algorithm efficiency.
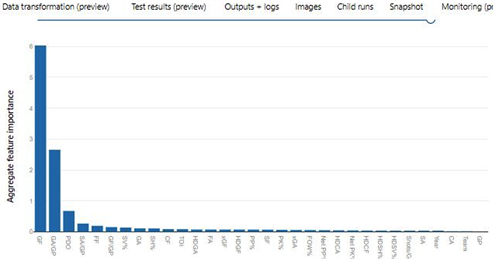
Initial Aggregated Feature Importance indicates that Goals For, Goals Against per Game, PDO are the top 3 important features:
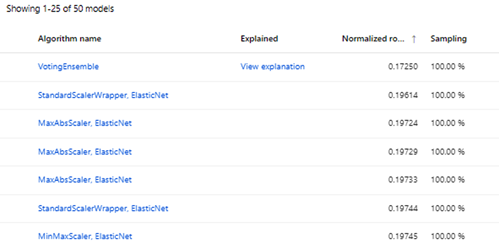
The Normalized Root Mean Square (NRMSE) indicated that VotingEnsemble algorithm ranked as most efficient.
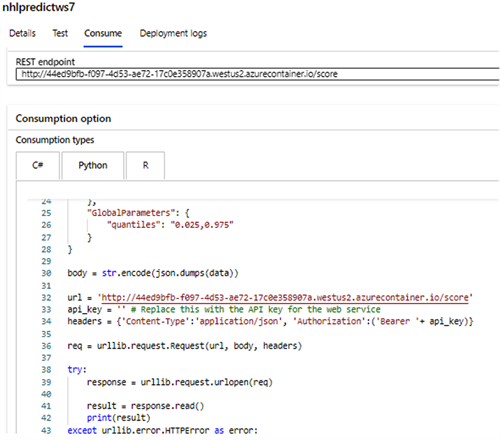
A real-time endpoint was created to, using the auto-generated Python code from within the Azure Portal. Which was used with minor modifications to generate 2022 NHL Predictions
Bonus: Microsoft Azure Machine Learning Tips
- Dates – use complete Dates (MM/DD/YYYY)
- Complete as much data manipulation as possible before uploading dataset to Azure
- Determine Naming conventions before starting models (workspace, experiment, compute instance, endpoints)
- Individual model runs are automatically named – record individual names
- Compute instance is limited in resources – only run 1 model at a time
- Time-Series forecast will require all known fields to predict – need to remove all unknown fields
- AutoML vs. Designer
- AutoML runs all algorithms (possible to exclude or specify specifics)
- AutoML allows for editing and resubmitting of model while Designer requires cloning of model and then new run to train
- Model in designer is faster to train since only 1 algorithm
- AutoML runs all algorithms (possible to exclude or specify specifics)
- Exit Criteria – allows for setting exit criteria (i.e. Time and others)
- One default is to exit if metrics don’t improve over last 20 iterations
- When training run is in progress – check model and child run tabs
- Indicators to show likelihood of failure
If you’re looking for historical data for you own predictive models we provide NHL, NFL, MLB and NBA data for free. Try SportWise for personal use or DataFeeds for commercial API access.